In a recent blog, I introduced the topic of test data reporting and the value of having a robust structure to maximize its value. In that blog, we talked about the six different levels of reporting sophistication, which we have identified in our work helping customers develop more effective reporting frameworks. Reviewing this information gives organizations a baseline for identifying where they currently are and deciding where they want to go. Consequently, if you haven’t yet read that article, I recommend you reviewing it.
In this follow-up, I will outline the core of the process: the six-step process to developing a functional reporting framework, from planning through deployment. I will also offer some insight into its value along with recommendations for achieving it.
 Why Go There?
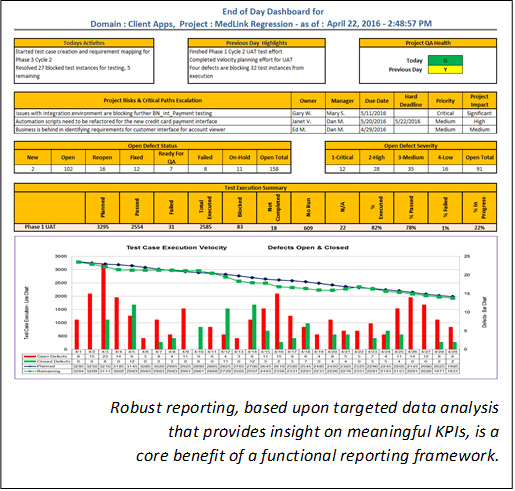
In software development and testing, proactive measurement of key metrics—consistently populated across the entire software ecosystem and documented through well-designed and executed reports—is one of the most important elements for continual improvement and positive change. Yet, many teams are challenged either to identify the most meaningful metrics and key performance indicators (KPIs) from software lifecycle data or organize them into an effective, actionable reporting system.
To reap the most benefit from such an effort, organizations must make it a priority to evolve a process for unified data extraction, analysis, and reporting that ensures consistency across the enterprise. When all team members in all domains are working with the same set of metrics, projects benefit from more insightful, cross-company analytics and more efficient decision making. Teams no longer have to identify their own metrics or develop their own reports, which reduces effort and ensures consistency.
Furthermore, the automation that is a necessary aspect of such a framework substantially curtails the massive resource overhead that manual reporting consumes. I worked with a company where implementing a standardized, automated, enterprise-wide reporting framework enabled the organization to reduce its man-hour expenditure for data extraction alone from more than 10,000 hours per year to fewer than 1,000 hours.
Although developing such a framework is time consuming, the results can be truly extraordinary, with greater data visibility and insight leading to informed decisions that reduce costs, accelerate release cycles, and improve quality.
Achievement Goals
Before it can be considered effective, a reporting framework should deliver the data-driven insights that enable team members and leaders to monitor the progress and improve the effectiveness of test case development; test planning and execution; defect removal; and other testing activities.
The program must also reach broad user acceptance, which generally involves more than regurgitating data in templated reports. For maximum uptake and value, results should be available in the form of user-friendly, easily digestible dashboards, scorecards, and other deliverables. Achieving the solution, end to end, is a fairly complex process that will require significant effort—even when automation tools are already present but not effectively used.
The technology platform that supports the framework should be capable of consuming and interpreting historical data for trending comparisons, and it should also be adaptable to new data sources and queries as projects and programs evolve. All of this input should populate across the entire testing ecosystem, automatically, with no additional customization required.
The Six-Step Process
Through our work with other organizations, we have identified six steps that provide the clarity and scope to produce a desirable outcome. Skipping any of these, or shortcutting them due to budget or time constraints, will reduce value and potentially result in user rejection.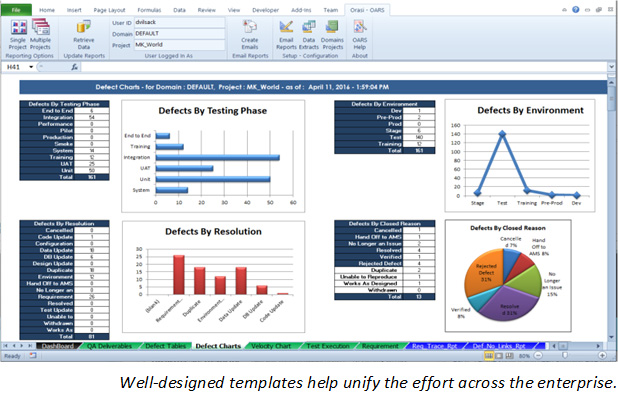
Phase 1 — Planning: Identify available data sources and isolate/classify the most meaningful reporting metrics and KPIs.
Phase 2 — Design and Build: Develop a unified structure that incorporates targeted data extracts, key metrics, thoughtfully designed templates, and user-friendly deliverables.
Phase 3 — Test and Validate: Verify the automated solution against production systems.
Phase 4 — Stakeholder Review: Demonstrate the solution in a production environment, and validate its functionality through final checks.
Phase 5 — Documentation: Develop user documentation and train affected personnel to ensure knowledge transfer regarding the reporting solution.
Phase 6 — Deployment: Orchestrate initial implementation and create a support system to ensure continued user acceptance.
Make It Happen
Starting such an effort can be daunting, and as mentioned earlier, there are no shortcuts. In the initial phases, teams will be using 20-30% of their working time to build out the framework. Furthermore, even after the framework is developed, periodic adjustments will be required to keep it current and effective.
Nevertheless, in every instance I have witnessed, organizations learn that no matter what they hoped to achieve from an advanced, functional reporting framework, they end up realizing far more benefit than they had planned.
If you’re ready to get started, stay tuned. In part three of this series, we’ll dive into metrics and KPIs—how to identify and classify them for greatest reporting value. This information will help teams gain clarity and eliminate confusion about their data, enabling them to move forward with confidence.