 In a recent blog, I provided an introduction to reporting and offered suggestions to help software professionals determine if their teams are using reporting effectively. I followed that up with a discussion of the importance of, and processes involved in, developing a functional reporting framework. Today, we are ready to talk about metrics and key performance indicators (KPIs).
If you read the earlier blogs, you may be excited about potential inherent in developing a more robust reporting framework. Perhaps you are taking initial steps to achieve the goals we outlined in those discussions. Kudos to you if that is the case. However, before you embark on a large project, it is essential to fully understand metrics and KPIs and be able to distinguish between them.
If you are reading this, you probably think you know the difference between metrics and KPIs. Be prepared for a surprise. Confusion has arisen, because in many instances (especially in business reporting), “metric” has become a convenient descriptor for any measurement, including a KPI.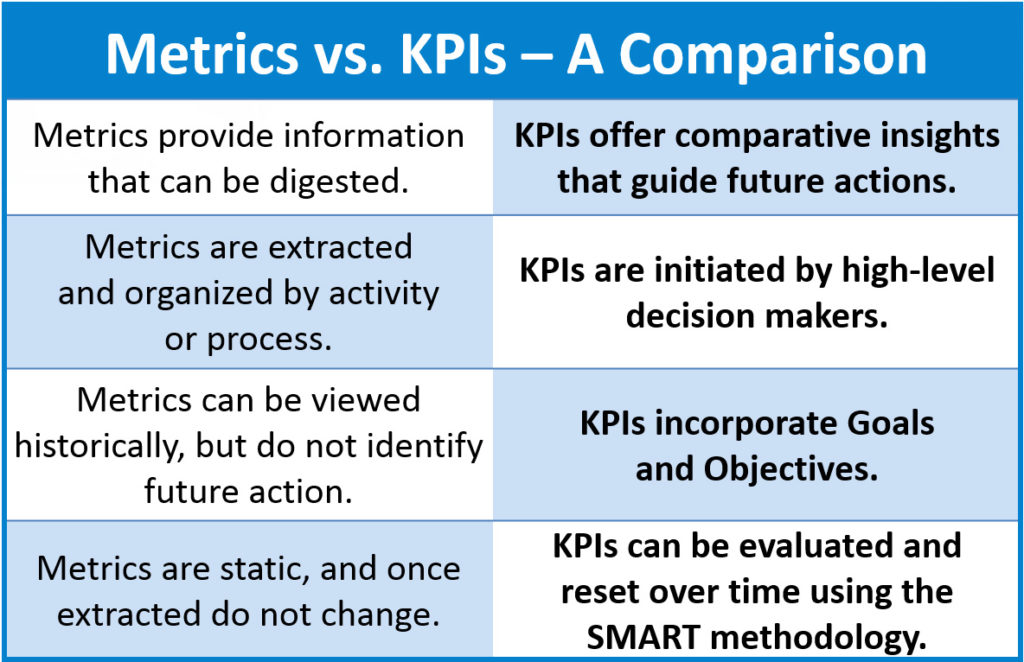
In software development and testing, however, a metric can only be defined as the raw data that testers, developers, and other team members identify and extract to obtain information about their efforts. In this context, a metric is a statistic that doesn’t answer questions or provide insight, unless it is used as part of a KPI. Until teams fully appreciate this difference, any reporting projects will not likely yield full value.
Why is this? Reports may consist of static numbers on a piece of paper, but the KPIs they express cannot be static. They are measurements that can be evaluated in the present but also must become part of a feedback loop—and an ongoing, goal-based decision-making effort.
Defining a KPI
A KPI is a specific, measurable, achievable, realistic, and time-bound (SMART) measurement—linked to a target value—that provides actionable data so stakeholders can make informed decisions. A KPI provides insight into how effectively a company and its teams are meeting clearly defined team objectives in pursuit of management-defined goals.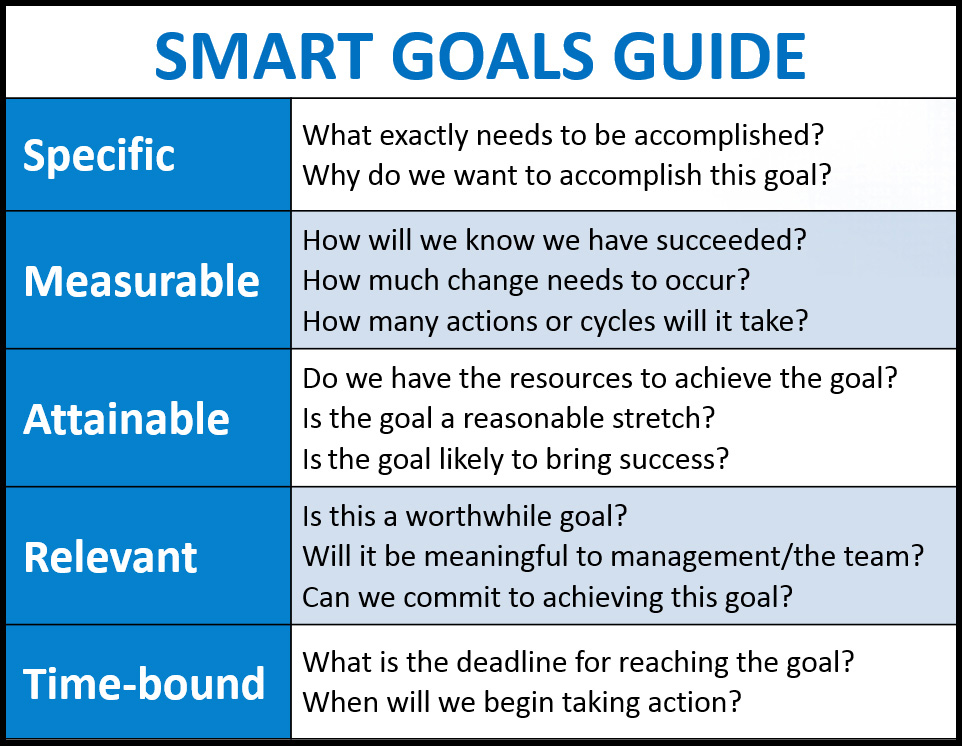
Confusion often arises, because team members mistakenly think that all metrics are actionable. This confusion is understandable. For example, if raw test data (metrics) indicate the number of defects is rising, a team can take action to reduce them. They can organize the data (often, using spreadsheets) by severity and develop goals and targets. All of these activities appear to be laying the groundwork for improvement. However, the metrics are not part of a structured, actionable framework for measurable, continual improvement over a specified period of time. In short, they aren’t SMART, and they don’t qualify as KPIs.
Here’s a Hypothetical Scenario
Let’s assume a team has identified the following metric: “In the most recent weekly release, there were 38 defects in the application under test.” Alarm bells start going off in the minds of some team members (not to mention the quality assurance folks), because for this release, 38 is a pretty big number. If the team members are not working under a structured framework for improvement, they might be ready to act upon this raw statistic as a KPI. However, to unite the remaining elements of SMART measurements and create an actionable KPI, the team must perform additional steps.
Let’s follow the information flow and see how an informed team and its management would achieve a true KPI and act upon it in a structured framework.
In the post release wrap-up meeting, the team reviews the data with the team lead or manager, who says, “Thirty-eight defects aren’t acceptable, but they could be an aberration.” He then asks the team, “What is the average number of defects you have identified over the past year? After review, the team determines that the average number of defects per release was 25. It’s now evident that either
- 38 was an aberration, or
- Something has changed that is causing defects to rise dramatically.
Additionally, the team now has a realistic idea of its defect levels—a baseline of 25 (the average), which forms the foundation that will identify the true direction of its defect numbers. However, it is still not a KPI.
At this point, another manager or director reviews the data and makes the recommendation that an improvement initiative is in order. They offer a specific directive for reduction, resulting in a clearly expressed request: “Going forward, let’s measure and evaluate the number of defects, with the goal of consistently reducing the number of defects by at least 10 percent from our baseline of 25.”
At this point, in addition to its baseline—25 defects—the team has a goal that is specific, measurable, and time bound—10 percent reduction in the number of defects per release.
Using the 10 percent reduction goal specified by management, the goal for defect reduction would be 2.5 (10 percent of 25); the team rounds up to a goal of three defects. The team and its management determine that a reduction of three or more defects per release going forward should be achievable. The team now has a KPI.
 Achieving Meaningful Results
The team assigns statuses for each achievement level for each release to help members benchmark their progress (or lack thereof):
- A defect number equal to or less than 22 will achieve the objective, which will be reflected in reports as a green status.
- A defect number of 25 indicates no progress was made, but the situation did not worsen, creating a yellow (proceed with caution) status for reporting purposes.
- A defect number above 25 indicates the team is moving in the wrong direction, putting the team in a red status in the report barometer.
With a valid KPI and supporting framework in place, the team or its leadership can now measure and record the number of defects over the specified number of releases, monitoring progress toward the goal on a per release level.
Chasing the Baseline
Once a KPI has been implemented, it should be evaluated over a long-enough period (e.g., six months, 15 releases, etc.) to provide a meaningful assessment of the effort, as compared against the original baseline, before further adjustments are made. A common mistake made by many teams is to change the baseline too frequently.
For instance, if the defect tally consistently moves toward red status rather than green, the team has an indication that the KPI might not be achievable. Nevertheless, management should not take action or adjust the barometer until the predetermined measurement period is complete. This is called “chasing the baseline,” and historical analyses prove this isn’t a success strategy. It negates the value of the effort. It isn’t SMART.
When the effort, staged over the full evaluation period, is complete, project leadership would report to upper management (hopefully with positive news that the goal has been met). At that time,  depending upon progress, the goal could be reset higher or lower—or left intact for another goal period. What began as a simple metric—38 defects—has now become part of an actionable, SMART KPI framework.
As time progresses, leadership can evaluate KPIs in the context of other factors to make adjustments, if appropriate. For example, if the number of defects suddenly jumps after a period of overall downward stability, management might discover that the number of updates in each release has also increased dramatically. Using that information, leadership could decide if it wanted to delay some updates to maintain application quality or adjust its objectives to accept a temporary spike.
Having true KPIs also enable management and its teams to turn attention away from efforts that are moving in the right direction, over time. In doing so, they can focus more closely on emerging issues or revisit those that are not progressing toward their objectives at a reasonable pace.
The Final Tally
In summary, KPIs provide insight into a project and its effort and provide data that is actionable and reliable to make informed decisions. Although we illustrated them here in the context of software testing, they can be extremely valuable in every phase of the software lifecycle.
Until software teams understand the difference between KPIs and metrics and use both appropriately, they likely cannot develop practical performance goals and objectives, nor can they establish a feasible path to achieve them—or even to determine if they are achievable.
As a result, they are usually unable to measure their own efforts effectively, making it difficult if not impossible to achieve meaningful improvement over time. That’s perhaps the greatest value that KPIs—and not metrics—bring to the table. They enable a steady, measured, sustainable march toward superior quality, not over 10 days or 10 weeks, but rather for the lifecycle of the application.