When your solution is too slow to meet your business objectives you need to optimize it. This post is primarily based on a recent optimization project we did using AppDynamics to improve their solution. I will note that there were a few browser side optimizations that we did as well, but they were found quickly and easily using webpagetest.org. Another great resource is stevesouders.com
The value proposition of the optimization went roughly in this order:
– Algorithms
– Errors
– Scale design blockers
o Server count, JVM memory, cache settings, max connections, timeouts
– Disk and Network IO
We also resolved a few High Availability configuration errors along the way, but those were incidental to the high rate of deployments and changes that we performed. The tool helped us recover very efficiently, and pointed out the demand for a script driven operations partnership. Devops to the rescue.
Algorithms
In Computer Science class, we spent a fair chunk of time looking at big O performance analysis. As a developer you would try to turn something that did N^2 operations into something N * log N. However, in the practical world, algorithmic analysis is validated with empirical data. What does that mean?
Measure it!
This realm of code analysis is known as call attributed profiling. We used this heavily when developing the C code within the operating system and hardware drivers. What AppDynamics has done, is brought this level of analysis to the distributed application space with their tag and following implementaion. Thus, when we created an accurate simulation of the JSON data complexity for the implementation in question, we saw some interesting behavior.
Looking closely at the stack trace below, where it is not redacted like in a spy movie, you can see that this operation looped 500 times. We showed this to the developer a few minutes into the performance test, and he explained that this was a model refinement algorithm that was designed to make the perfect subset. He was very excited about how fast it worked on his local machine.
When we showed him what happened under a more realistic data set, we came up with a few options. He figured out an easy way to limit the refinement loop with an external setting. Then, we determined the target latency goal for the operation was 100ms. We chose five different settings, and we ran those five tests and compared the data. This all happened on the same day. Because we were able to see the actual loop count each time from within AppDynamics, we fixed the cap limits in several other places in the code too.
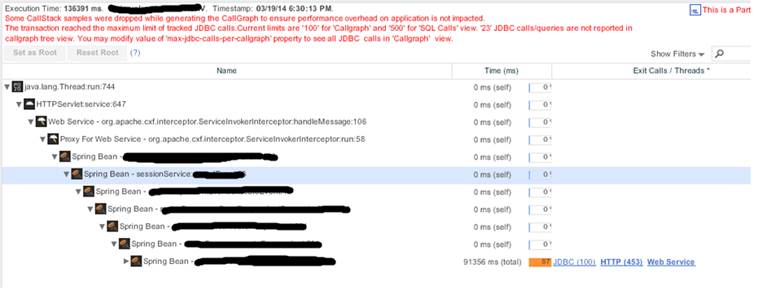
Without the ability to pull out the slowest transactions automatically, we would not have been able to tune this efficiently. The loop count only exploded under certain relatively non-deterministic data permutations. This means that sampling would have made debugging very hard.
Errors – Exceptions
I might have put this one in front of the algorithmic analysis, but in this particular scenario the errors generated false good performance. From the LoadRunner perspective the throughput was meeting the targets, but the error rates from the UI tier were going up to almost 5%. In a system as complex as the one were testing, this might have been excusable in the world prior to AppDynamics instrumentation.
However, from the default dashboard we saw the exception count skyrocket.
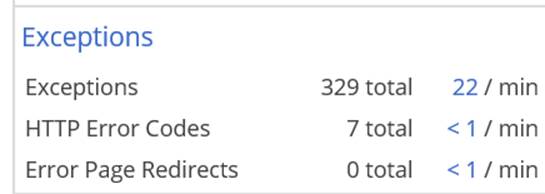
Then we clicked through to see that the exceptions were new since 10:00 from that morning. And the actual exceptions were
java.lang.NoClassDefFoundError
We asked the team what had changed at 10:00, and we discovered that a new JAR had been released to a few of the servers to address a code error. With a few quick searches online we had the development team off to research the errors within their build process. This one actually took a few days to resolve because the errors permeated the overall solution dependency map. They had to dig into their Maven from the ground up. The great news was that this issue had been lingering for months but there was no tangible impact from other validation means. In other words these exceptions had been logged but ignored.
Configuration Error
Another cool error we discovered quickly was a configuration error that was manually introduced during a planned server change in the test environment. This one had funny behavior in two disconnected components.
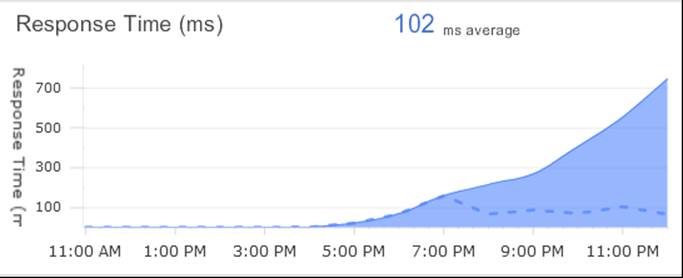
In the figure above, we have the response times to an external third party web service. Then at the exact same time we had this response time graph to an internal MSMQ.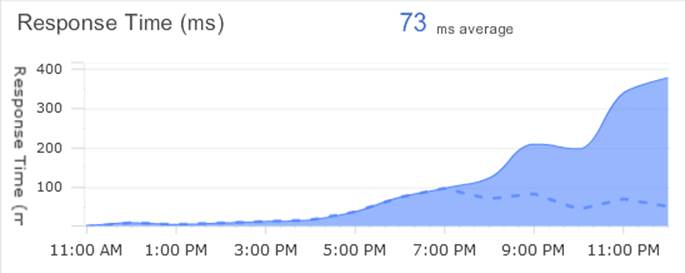
Without knowing how the application worked in detail, we could see the visual correlation. The architects knew that these calls were actually synchronized implicitly and we discovered quickly that under a particular scenario the calls to the external web port were misconfigured. This quick fix was done in under an hour.
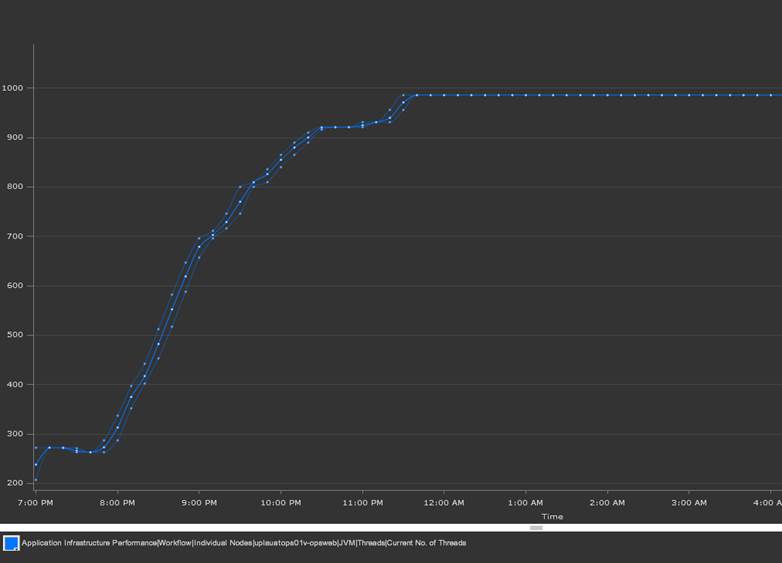
Thread Pool Constraints
A JVM host has a configuration for the maximum number of threads that it will contain within its process. If the server workload requires a large amount of parallel activity under load, the solution can run out of threads to do this work before it runs out of the more common resources such as CPU, network, or memory. In this case, we carefully tuned the thread pools across more than 10 components to maximize the usage of the servers.
AppDynamics produced graphs and time accurate settings for the JVM configurations. We used this feature to analyze and design a series of tuning templates to try. This experimentation model was highly efficient compared to a whiteboard exercise. We quickly devised 10 options that we scripted with the middleware operations teams. Then we tested all of these options with our load simulation over a three day period. The results generated a specific set of tuning parameters, but it also provided a hypothesis driven model to optimize tuning in the future for when the code or data eventually changed.

Disk IO
The next phase of slowdown we saw was a common problem in many J2EE solutions. Since I had seen this several times before it was not a surprise. We saw ‘very slow’ transactions across a range of business transactions and logical areas. However, within them I saw log4J calls. From experience I knew that misconfiguration of log4j could perform synchronous logging to a local disk. So I looked into the hardware counters and saw this.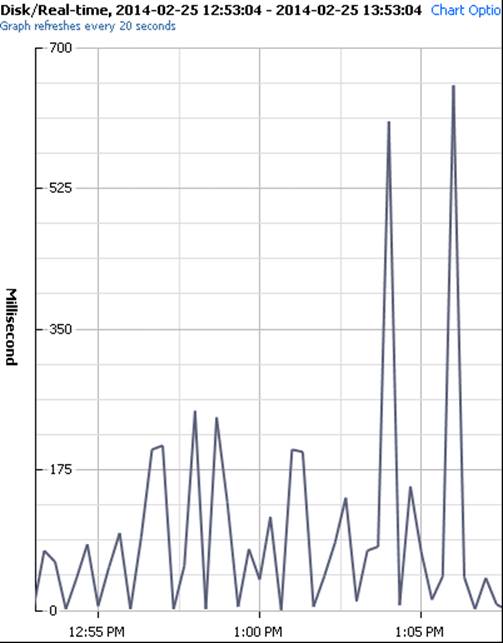
However, instead of solving the issue with configuration changes, which I had done a few times in the past. We instead updated the log4j calls to the new log4j2 API http://logging.apache.org/log4j/2.x/. I highly recommend anyone that is still using the old logger to make the upgrade ASAP.
And in the end…
We were able to optimize this complicated app in record time. We put in proactive hypothesis driven testing, that I hadn’t been able to use in the J2EE space up to this point. And we kick started our engagement with AppDynamics as a partner.