Let’s consider how code coverage and other similar processes, as requested, fit within the workflow of an application during design and development. I think of this in the following stages:
- Local development – quality analysis
- Centralized build – quality analysis
- Test coverage workflow (next post)
- Test case coverage evaluation (next post)
Local Development – Quality Analysis
In the first use case depicted in figure 1 we address a workflow for a developer using Visual Studio 2013 or Eclipse to do their software development.
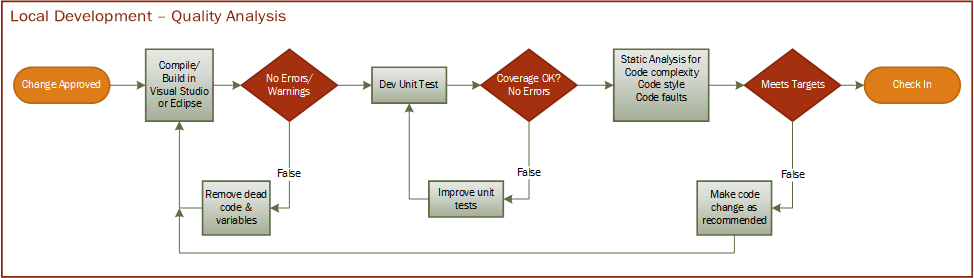
Figure 1
In the first step, the developer works on code changes related to a requirement or defect. This correlation can be tracked in HP ALM as well as many other development orchestration suites. The workflow suite associates the code change to requirements or defects automatically. This tool assists the test team in quickly associating a change. Requirement input coverage will be covered in the next post, but we really like GT Agile Designer.
After the developer makes changes to the source code and unit test code, they perform the compile and build process within their local integrated development environment tool (IDE). For the purposes of this proposal, we reference Visual Studio 2013 for Microsoft development and Eclipse for Java. Both of these tools have a rich suite of freely included mechanisms for improving code quality before the integrated tests are engaged.
With a few small changes in the build scripts or UI settings, the tools will identify the dead code and variables as requested. When these changes are first enabled within an existing application, there might be a large number of these issues identified. These defects are commonly called technical debt. There are a number of great processes for dealing with this, which are very interesting but out of scope for this post.
The next phase of the build process is the execution of the developer’s unit testing. Note that all of these phases occur within a few seconds on a modern workstation. We are leveraging the power of Moore’s law to drive quality processes into the human component of software development. The output of unit tests always includes the coverage. Please see the screenshot from Visual Studio 2013 included below in figure 2. The branch coverage is in line with the code to make it as efficient as possible for the developer to address the fix. Essentially code coverage is best addressed at the development level.
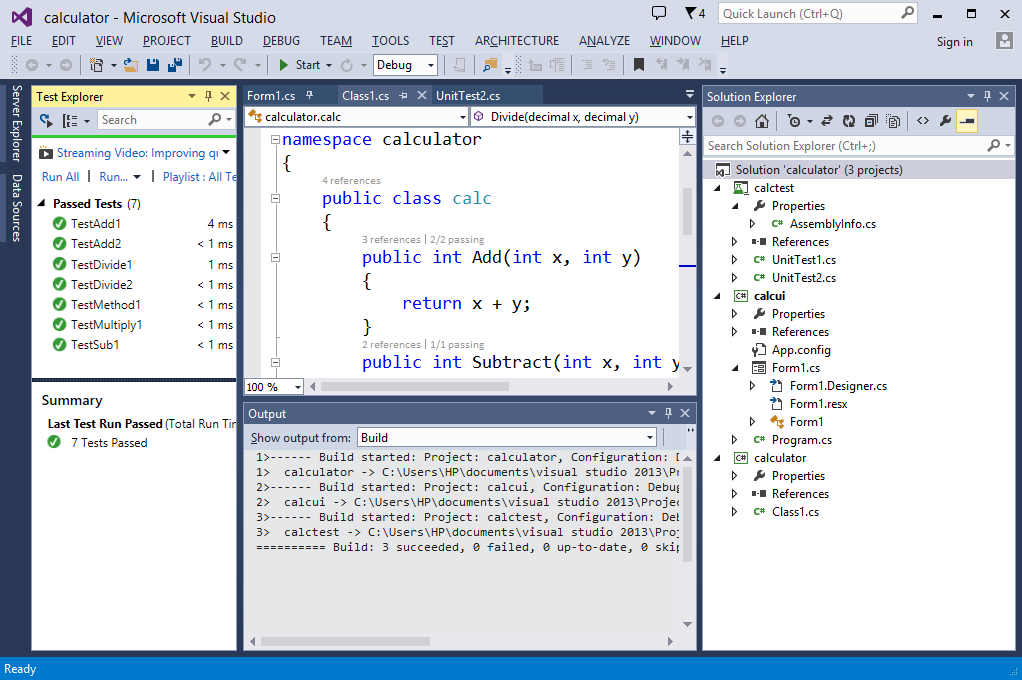
Figure 2 – Unit test coverage inline with source code
The tool suite also performs static analysis to capture a range of faults such as:
- COM (Interoperability) – rules that detect COM Interop issues.
- Design – rules that detect potential design flaws. These coding errors typically do not affect the execution of your code.
- Globalization – rules that detect missing or incorrect usage of information related to globalization and localization.
- Naming – rules that detect incorrect casing, cross language keyword collisions, and other issues related to the names of types, members, parameters, namespaces, and assemblies.
- Performance – rules that detect elements in your assemblies that will degrade performance.
- Security – rules that detect programming elements that leave your assemblies vulnerable to malicious users or code.
- Usage – rules that detect potential flaws in your assemblies that can affect code execution.
- Maintainability – rules that detect maintenance issues.
- Portability – rules that detect portability issues
- Reliability- rules that detect correct memory and thread usage
- The following screen snippet shows the default rules recommended for an application in figure 3 below.
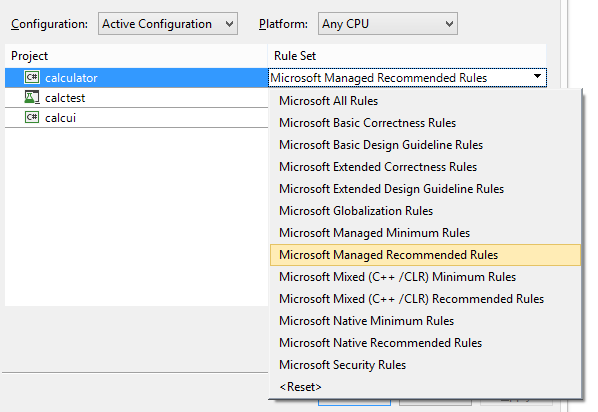
Figure 3 – Static analysis options for Visual Studio 2013 Ultimate
In summary, the developer has a rich suite of code quality tools for doing enterprise level software development. Note that these checks must be done prior to each check in to the centralized version control serer in order to minimize faults.
Centralized Build – Quality Analysis
The second use case addresses the automated processes that a centralized build team manages. Most of these steps mirror the processes that an individual developer performs. When the steps are identical the processes catch the more complex code interactions related to multiple changes occurring within a build window. We recommend checking in and building as often as possible to minimize the number of editors contacted if any of the failure criteria are hit. Figure 4 shows the workflow process which automatically connects with the version control system to identify the recent editors.
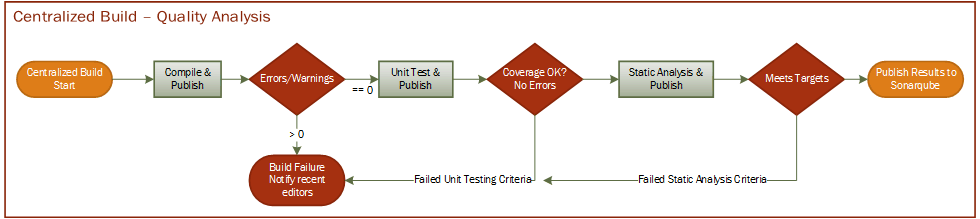
Figure 4
Within the context of coverage analysis, the centralized build process is associated with the official builds so the coverage, unit test results, and static analysis are all published to the code quality dashboard. Sonarqube is an open source tool for capturing the results of these tools. This dashboard is very configurable and compatible with a broad range of tools. This first screen shot shows a view of a sample project in figure 5 below.
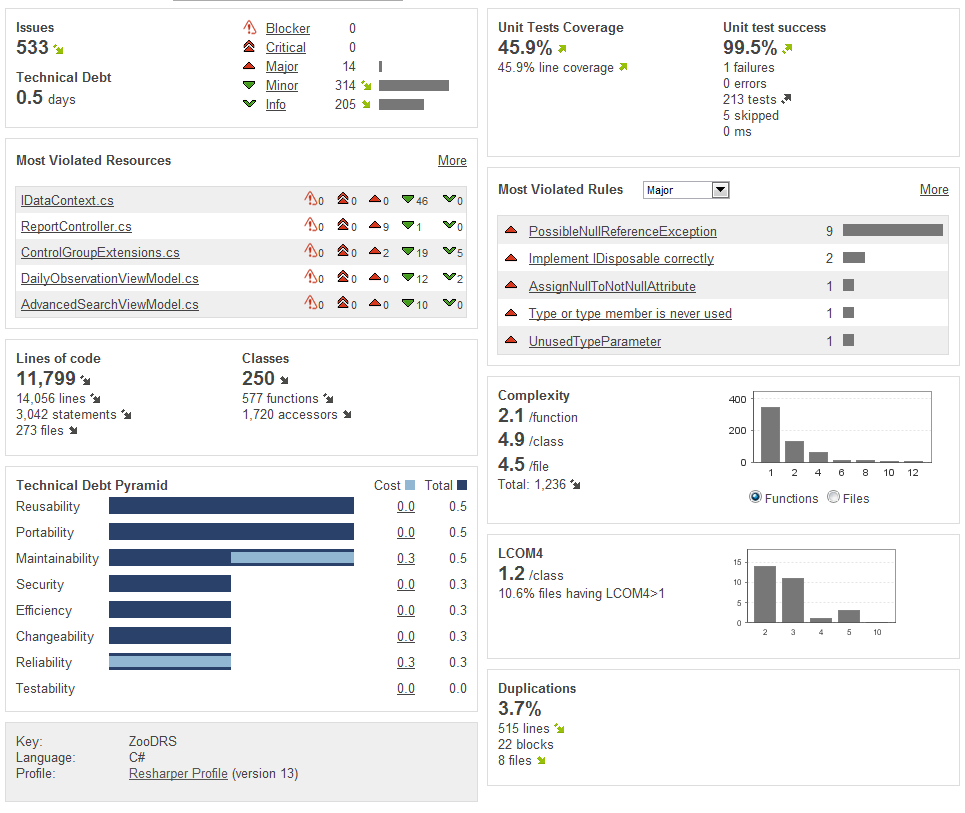
Figure 5 – Sonarqube samples
Transparent results, from code quality tools, help improve the overall visibility to everyone associated with the project. After teams implement this dashboard, the exposure drives clear goals for improved code engineering quality. This is commonly known as developing the quality in. This development driven focus helps create a better product to the downstream test engineers. These tools are also very easy to implement. There are 10K+ active users of Sonarqube in production worldwide. For our most recent customer, we were able to add all of their .Net projects to a local and enterprise implementation in less than 2 weeks including the training and executive presentation.
“Sunlight is the best disinfectant” – Justice Louis Brandeis
The test team could also leverage these results to help drive testing coverage for areas that show poor code quality results. After the test team finds a few major defects in these areas, the developers and their managers will be more compelled to fix these faults before they enter the integration test process.
By David Guimbellot, Area VP of Continuous Delivery & Test Data Management at Orasi Software