One of the best ways to improve the quality of IT solutions is to leverage automation, to shorten the iterations between changes and validation. Let’s start with the tools available to a modern software developer.
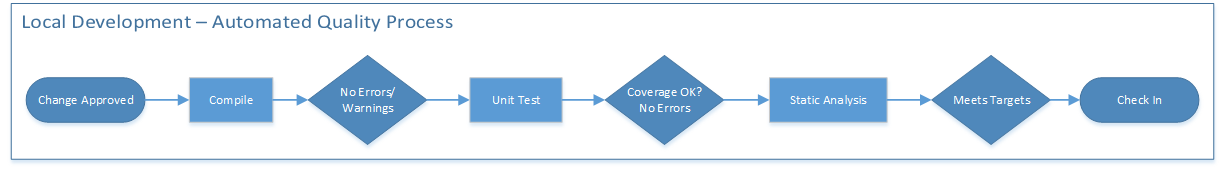
In the diagram above, a developer has some code ready to go and they have an approved change ready to add to their local copy of the source code. Note that, in this process, the developer is rapidly making changes and syncing their local source control, Subversion (SVN). This will keep them as up to date as possible with the other team members who are working on their changes.
The developer compiles the code locally and validates that the changes do not generate errors or warnings. If there are no errors or warnings, the build moves forward to deeper validation.
Next they execute their unit tests, which execute on their local machine. These are typically run within the IDE user interface. They are not recorded. These tests are at the function level and essentially validate that the algorithms logic is laid out clearly. In my experience, this is a great way to really force a deep understanding of the code itself. These tests have very little to do with a piece of business functionality. They greatly reduce the risk that a developer accidentally breaks something within their own local span of control. As this process matures, the development team will impose a greater level of coverage targets on each other to generate continuous improvement. More unit tests reduce risk for subsequent changes. Plus it’s a lot easier to maintain someone else’s code if there are unit tests. Once upon a time, developers would complain about undocumented code; now they are stressed about code without unit tests.
Logically the static analysis could run before the unit tests but, for the purposes of this diagram, they occur afterwards. These tools analyze the code for errors specific to function or usage level errors in the language itself. For instance, the tools are great for examining the usage of public, static and private variables. They also help point out errors in flow related to conditions and exceptions. Since so much of software coding is based upon conditions and branching they often analyze the code for the sheer complexity of each function. If a developer designs a module with too many options then it generates a warning for that too.
Another class of static analysis tools looks for security risks. These tools are updated with the latest signatures for code level patterns that are under attack by hackers. Using these tools during the build process can help prevent security holes from ever entering the code base.
If all the above checks are OK then the developer checks the code into the code repository. In this process, the more often the developers synch their locals and check in, then the more efficient the overall systems are. Shorter batch cycles provably reduce risk and improve throughput.
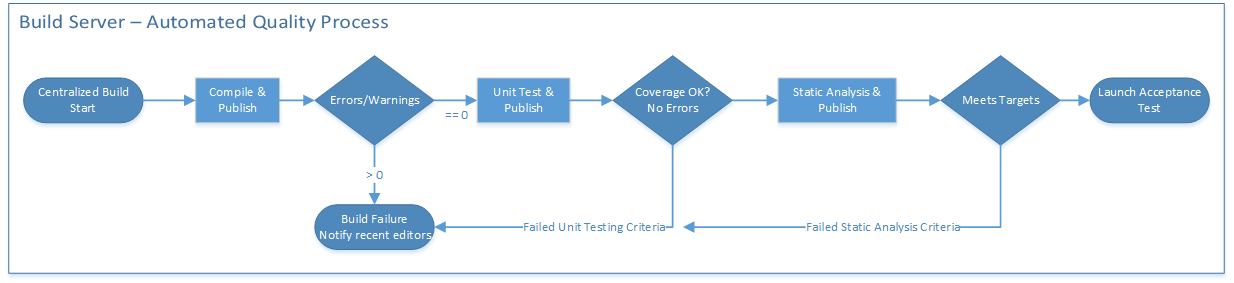
The build system pulls all the changes (synch) from the central code repository. This collects all of the changes from the team for the project so this is the point where multiple changes are coalesced and validated for compatibility.
There are a number of ways to operationalize the automated build server. Ideally the more often the build server can run through the validation processes enumerated above the more granular and more effectively the test suite can pinpoint the change which broke the build. A great rule of thumb is to keep this automation and publish cycle running every hour at the minimum. These concrete goals help the whole team design a build infrastructure to support a great solution.
The key difference between the local build that a developer does and the centralized server is the publish step. At the end of each phase the build server will publish the results to SonarQube and/or a Jenkins dashboard. The engineering leaders use this historical trending to monitor the improvement and throughput of the code changes. They can quickly see where backups occur to work in progress and manage the workload queues against risk.
Additionally these data provide the qualitative assessments for the improved engineering workflow that come from better unit tested and statically analyzed code. For the test team these data provide a critical measurement for selecting the best built to take into the Acceptance test phase.
Note that this can also be done in the Visual Studio world. The following anecdote comes from a Windows shop.
Every hour the build system would attempt to build the most recent changes as a “candidate build”, and if it failed it would warn everybody who had checked in and that build would be marked dirty. During the day people would fix their build breaks and finally a candidate build might complete. When it completed a comprehensive set of L0 (unit) and L1 (functional) tests would run against it, and if it passed it would be marked as the most recent candidate. At the end of the day, or after midnight, if there was a new successful candidate that day, it would be promoted to the official build and run the L3 (end-to-end) tests on it.

Similar to the automated build process above there are a number of ways to operationalize the automated acceptance test process. The key to this test process is once again the quickness that it can generate results. This does not mean that the choices should negatively impact coverage goals. Instead it should foster ideas for optimizing the test automation via pair-wise analysis, testing with horizontally scaled test tools, and quickly parsing of validation data.
There is a parallel process that occurs to the diagram above where the changes for the build are propagated to the system under test environment.
The QA engineering team owns and operates the steps in the diagram above. In the first step of the process the automation creates a test tool VM from scratch. This improves the repeatability of the testing by eliminating the chance that the underlying environment has become corrupted. I will further add that by creating a unique VM instance the tools should be more easily horizontally scaled as test automation coverage and scripting increases. These unique VM can also be halted with their memory intact in the case where they find truly unique issues.
Then the process will install the latest version of the testing tools from a central location. This will further insure that the test system is using a well-known and robust solution. It also minimizes the risk that another script or user has broken the testing application.
In the next step the automated validation process will synchronize the test scripts from the centralized code repository. This step will help improve the quality of the testing scripts by requiring all of the scripts to be ready to run on a remote machine. This will also provide a clear location for backup of this important engineering work. In addition this helps provide a very quick and easy way to reproduce the documentation that might be required for an audit process. Then the scripts are validated for correctness.
The test data management processes can occur in conjunction with the test script process. But for the purposes of clarity in the diagram, they are in order. The key goal for test data within the acceptance process is to provide reasonable coverage quickly. These tests will run much more often so the testing should lean toward read-only activities to minimize the complexity and impact to the persistent storage.
And finally the tests themselves should execute and automatically parse and store the results. These results help inform downstream testing of what to expect out of the newest build into their environment. Ideally with improved processes the timeliness and quality of the builds will show within a few cycle of a successful implementation. This will allow everyone on the teams to focus more upon value added work that is best solved via automation.
For Operational Readiness enthusiasts: the validation processes and checks performed by the verification suite in the above recommendation are typically done with software development focused tools. In order to further improve the reliability and focus on production sustainment automation I recommend leveraging the monitoring tool stack. This transition can happen at the staging or performance validation environment. The logic or scripts used to perform validation in testing can and should be shared with the support teams. The tool choices and reporting locations can also be simplified. Stay tuned for more updates along these lines.
David Guimbellot, Area Vice President of Test Data Management & Continuous Delivery at Orasi Software