Whenever I work on a performance problem, I need a maturity assessment of the existing requirements. A great place to start is characterizing the performance issues from the stakeholders. Let’s separate this into three archetypes to guide the discussion: Subjective, Low Precision, and Monitored. For each of these, I will try to describe some patterns and practices for making the current requirements more substantive so I can establish a way to green light the solution for operational readiness.
Subjective
Subjective performance requirements are usually a result of incomplete non-functional requirements. In this scenario scalability is usually not the only problem. Some examples of subjective performance goals are:
– The users of the application say that the UI is ‘spinning’ all throughout the day
– At busy times of the day the system slows down
– We see more errors in the orders at peak windows on Friday night
Performance or scalability issues typically fall into this category when an organization does not have a clear plan for measurement. If they do have strong measurement and monitoring in production, then the changes are easier. Essentially this team needs to establish better communication between production support/sustainment and the development teams.
As a problem solver, one of the options would be to “tune the box”, you could dive into the hardware counters on the servers. This is definitely one of the next steps and it might provide some quick wins, but performance engineering is very rarely solved by adding more hardware or tuning the infrastructure without clear requirements. In fact every customer I’ve come across has already added hardware until they ran out of budget. The hardware vendors love this plan.
Performance testers often start writing a load script that emulates some user behavior. If you do this then you are moving in the right direction but once again this is really just coding to an undefined requirement. The customer in this situation might even be happy because they wrote the application without requirements anyway. Really the first issue to resolve is to determine what a successful solution should be. Let’s tackle the subjective list one at a time.
Spinning?
If the users believe the application is spinning, we need to figure out what that even means. At this point I go visit a user that can reproduce the problem. Screen sharing technology is my friend in this scenario because I can see a range of users quickly. It turns out that by “spinning” they mean that the mouse cursor is doing the Macintosh OS X Rainbow pirouette.
When a UI is slow there are several considerations. UseIT, which hosts Jakob Nielsen’s content, has a great article which I have used as a basis for requirements for over a decade. In a nutshell I frame up the performance goals like this:
– UI controls need to respond to actions and animate within 0.1 seconds.
– Small operations should return results or render the page in 3 seconds. The goal for smaller operations is really 1-5 seconds, but if you start at 5 then you will be hard pressed to achieving the mean average of 3 which is really just OK. I’d prefer to see operations respond in less than one second.
– Longer processing should be less than 8 seconds. Note that any operation over 3 seconds by design should provide user feedback that the system is actually working.
So in this case, the next step is to enumerate the critical user operations and find out how the system currently behaves. And of course we also need to measure this scientifically. We’ll have more on statistics and measurement when we lay out a KPI reporting spreadsheet. For now let’s create a simple list of the user operations and targets.
Table 1- Simple Transaction Goals
| Transaction |
Goal in Seconds |
| Login |
3 |
| Add default flight |
3 |
| Customize flight |
3 |
| Check out |
3 |
| Create new user |
3 |
| View status |
3 |
This simple table bridges the gap between a business users’ expectation and an engineering goal that is quantitative and thus measurable. Computers are great for measuring time accurately so this step forwards is a strong one.
Implicit in this table is the definition of a transaction. The communication with the end users or stakeholders establishes a concrete list that matters to them. Please note that when we do scalability testing later we will investigate the transactions based upon a performance impact analysis that might add/remove some items from this list. Another element to consider is whether the performance team should expose the requirements as friendly names like they are shown in tables 1 and 2, or the actual web page names as used in table 3 below.
Note that we could also create an underlying set of goals for the UI controls in the solution and their responsiveness. That level of performance is important for applications that develop their own animations and controls. In the mobile and custom web development world, the UI controls are more risky than they were on thick client solutions. These targets assume that the data are locally available because a network traversal will probably result in a failure if it is an Internet application.
Table 2- User Interface Latency
| Flight Wizard UI | Goal in Milliseconds |
| Sort by time of departure |
200 |
| Select flight class |
100 |
| Hover on date |
100 |
| Open calendar control |
200 |
| Select date in calendar control |
100 |
For the sake of this blog, let’s assume that since the problem happens throughout the day we will classify this as a performance problem independent of load. In other words, throughput and hardware utilization are probably not the risk. You might ask about best practices for measuring these goals. Please do. Since this is a blog, I need feedback on what you want to see next. However for now I’m focusing on requirements.
Busy Slowdown – At busy times of the day the system slows down
Once again, the IT team is relying upon the end user perception to gauge the quality of the solution. For this scenario, we need to perform a similar analysis with a slightly more complex dialog. In essence we still need to establish performance AKA latency success criteria for the user operations, but we also need to find out which operations change the most during the busy periods. Let’s call the time that the systems slow down due to volume of requests the peak.
Table 3- KPI Goals against Actuals
| Transaction |
Goal in Seconds |
Latency at Peak |
| Login |
3 |
4.3 |
| Add default flight |
3 |
11.2 |
| Customize flight |
3 |
3.1 |
| Check out |
3 |
16.5 |
| Create new user |
3 |
3.3 |
| View status |
3 |
2.7 |
In the table above, we characterize the slowdown in more concrete terms. These slowdowns should be measured over a sample size that makes them accurate. Additionally these measurements should be repeatable. The latency for web pages are stored by default in the last column of the web log. This is the first few rows of an IIS web log.
#Software: Microsoft Internet Information Services 7.0
#Version: 1.0
#Date: 2013-10-22 04:06:19<
#Fields: date time s-sitename s-computername s-ip cs-method cs-uri-stem cs-uri-query s-port cs-username c-ip cs-version cs(User-Agent) cs(Cookie) cs(Referer) cs-host sc-status sc-substatus sc-win32-status sc-bytes cs-bytes time-taken
2013-10-22 04:06:19 W3SVC1 comp1 10.40.8.35 GET /foo/ – 80 – 192.1.1.1 HTTP/1.1 Mozilla/4.0+(compatible;+MSIE+7.0;+Windows+NT+6.1;+WOW64;+Trident/4.0;+SLCC2;+.NET+CLR+2.0.50727;+.NET+CLR+3.5.30729;+.NET+CLR+3.0.30729;+Media+Center+PC+6.0;+InfoPath.2) – – 192.1.1.1 200 0 0 3555 322 780
For the sake of this blog post, we’ll assume that the system does behave reasonably when the system is not ‘busy’; so in this case we need to establish the next layer of requirements for scalability. This means that the solution must achieve the performance latency success criteria with a certain volume of activity. So at this point we create what I call a usage profile.
In order to determine requirements we need to create a model that accounts for
– Concurrent users or throughput at the peak
– Time and intensity of peak
– Length of session
– Page hits per session
– Page hit rate distribution
There are a broad range of ways to monitor and collect this information. Most of the data are stored in the HTTP server logs. There are a broad range of tools for examining these tools to generate the data.
If, for example, your site is enabled with Google Analytics (GA) on the Audience Overview Homepage you can set the view to hourly and find the peak hour visually by narrowing the date selection.
Additionally GA calculates the:
– Visits per hour
– Pages per visit
– Length of Session
– Average visit duration
Then you can capture the page hit rate distribution by selecting ‘Visitors Flow’ under the Audience selection in the left pane. This will create a directed graph of page usage that will inform the creation of the UCML. For now though you can just capture the screen shots.
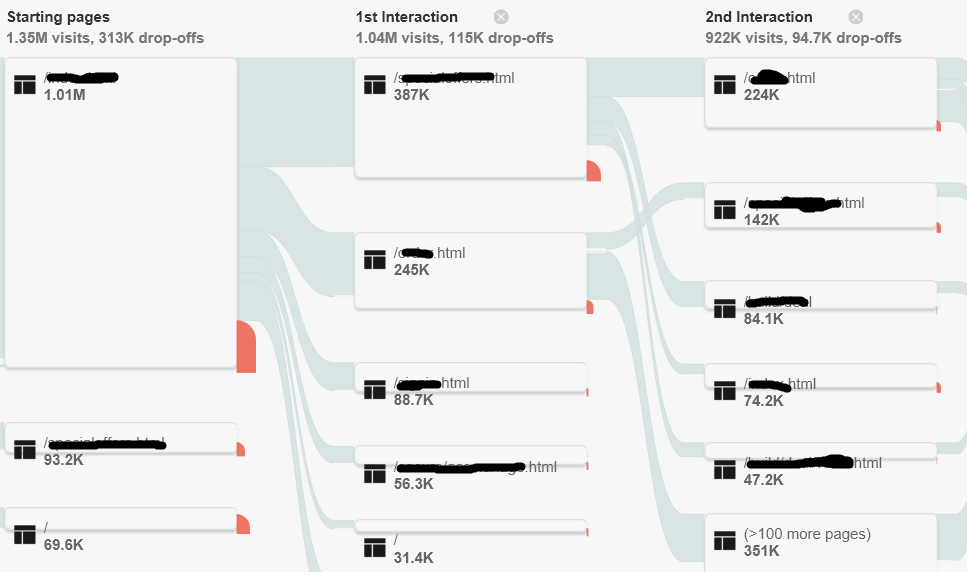
Figure 1-Google Analytics Visitors Flow
If you don’t have Google Analytics, which establishes the end user click stream statistics, you can create a model the old fashioned way and simply sort and order the log output in Excel to capture the top 90% of activity like this. Note that this table captures the throughput for the peak hour of the system. This level of data is very useful to drive the performance optimization as well as the load simulation. Without an accurate distribution the troubleshooting team could be wasting their time optimizing an element that has very little effect on the overall slowdown.
Table 4- Web Page Throughput & Distribution
| Page | Count | % of Total |
| Button.aspx |
14626 |
30.10% |
| Edit.aspx |
9563 |
19.70% |
| Worklist.aspx |
5888 |
12.10% |
| Digital.aspx |
4851 |
10.00% |
| SelectBz.aspx |
3363 |
6.90% |
| ViewText.aspx |
1989 |
4.10% |
| ContentDL.aspx |
1805 |
3.70% |
| Search.aspx |
1621 |
3.30% |
| Filter.aspx |
692 |
1.40% |
| login.aspx |
667 |
1.40% |
| Grand Total |
45065 |
92.70% |
Errors during Peak Windows
Then, in a number of scenarios, I have seen the teams capture performance results from a small subset of users. These results are great for establishing the fact that a problem exists. For example, in the table below each of the end users captured their experience manually.
Table 5- Per User Latency Results
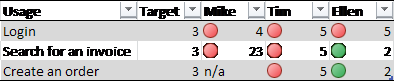
The danger of this form of measurement is the following:
– The measurements are not very accurate because the timing must be done by a human
– The number of measurements are quite low compared to the amount of data you can capture via computer logs and analysis
– Mike, Tim and Ellen might have a different interpretation of ‘Search for an Invoice’
– The time it takes to validate a performance optimization will depend upon this user group’s availability
In any event if you find yourself in this position, I highly recommend taking advantage of the tables and mechanisms prescribed above.
I will save the discussion of Low Precision and Monitored for the next post.
David Guimbellot, Area Vice President of Test Data Management & Continuous Delivery at Orasi Software