Talking about testing, most of the time we are used to working with sets of data that will be used over and over again. Then a refresh comes to the environment, and again we will have the same data, maybe some changes or addition will come but it will be the same.
Most of the time, this data comes from production, and when we talk about production data we know that multiple issues come along.
The first one is creating the rules that will bring the data we need, meaning, the subset rules. Sometimes this may not be a complicated thing to do. For example, if the testing team is looking for just generic data, then a full copy can be made.
However, what happens when you are looking for specific data? The team that is creating the subset needs to have a deep understanding of the database model since they will need to generate the data set based on the specific needs.
Along with the subset idea, two significant factors are present: TIME and STORAGE. When creating a subset, planning will always be necessary since we are creating a copy of the data we already have, and as we know this process can be slow and a high resource consumer.
We have created our subset; now we have a greater concern to face: SECURITY. When taking data from production we need to be sure to remove all sensitive data we may have, and what does that mean?
The data must go through a profile process that will lead us to create masking rules that will get rid of all names, phones, social security numbers, credit card numbers, and all that info that can get to the testing environment.
All this sounds like a bunch of work to do every couple of weeks or every time we need to refresh an environment, even more if we maintain multiple ones.
After all this work we may believe that we have enough data to go with the test, right? Usually, that is not correct. Typically, your production data will only provide a 10-20% coverage and talking about coverage, which is a small percentage.
It would be great if we could get the exact data when we needed it, with less effort and in less time, right? Well, that is the purpose of Grid Tools Datamaker, a tool that will help us create synthetic data.
To start using Datamaker, the first thing to do is a recon on the structures we are going to be using. This phase is the most important since the analysis will give us the rules we will follow to replicate all of the characteristics of production data.
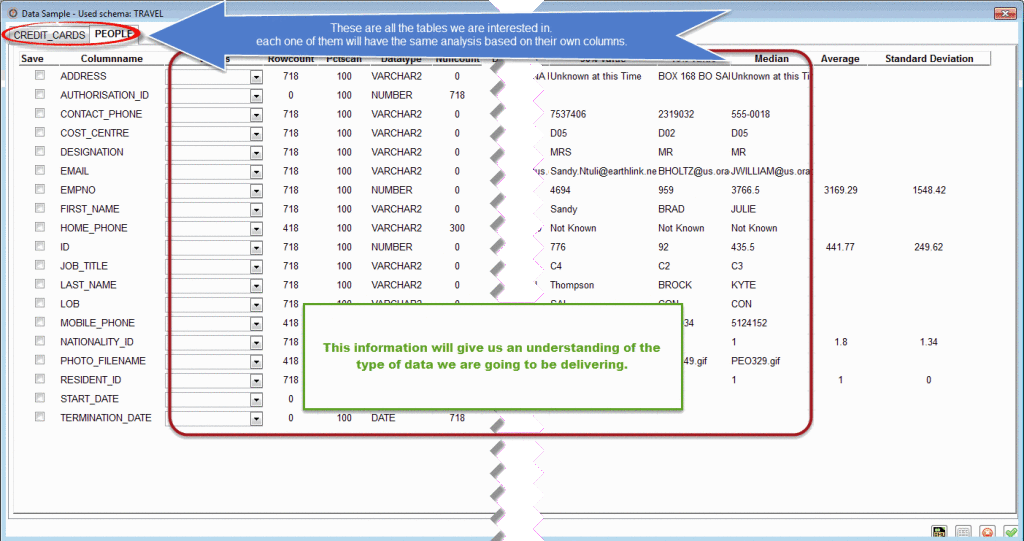
Grid Tools provides us with an extremely helpful Profiling tool that will take a sample of the data our source has. The source might be the current DB we are using for testing, a target or a golden copy we might have from production.
The Profiling tool will give us a quick understanding of what we are dealing with, we can see the different values we have for each column, its type and if we can leave it empty.
Now that we have an idea of how the data is formed, it is also important to know how all these tables are related. Sometimes the environment teams will have a DB relational model, sometimes they do not. Sadly the second option is the most common one, and that is why Grid Tools has another feature that will be useful: GT Diagrammer.
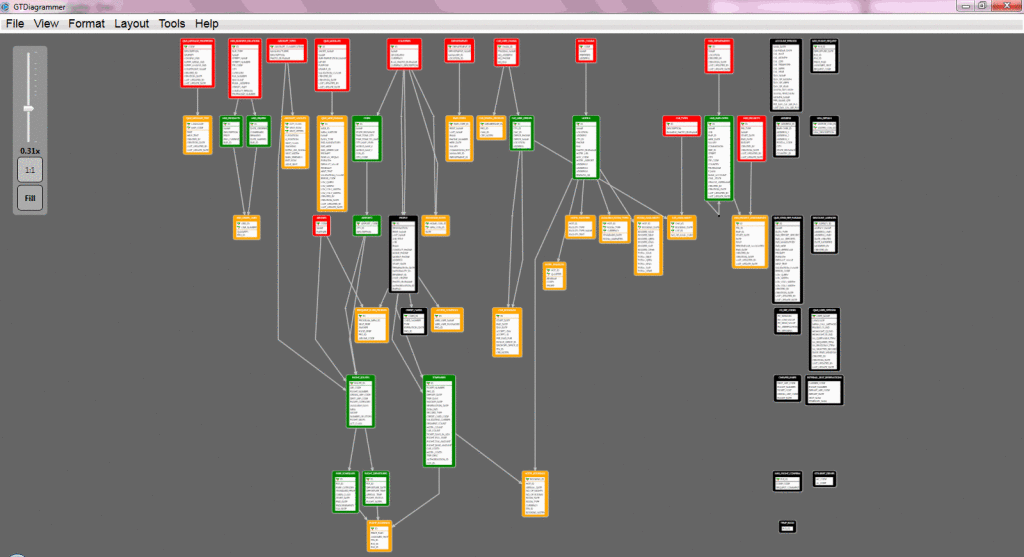
As its name makes reference, GT Diagrammer will create a “diagram” of all the tables’ relations we have on the project. This graphic will help us see which tables have children or which ones are not related at all. This may sound like a small feature, but when you are getting to know the system you are creating data for, it proves to be very useful.
While we “play” with the different options GT Diagrammer has, it will prove to be more and more versatile, we will be able to see multiple layouts options and even remove relations if needed.
On this image, we can see how a diagram is displayed with GTDiagrammer. One of the most helpful features is that it identifies using multiple colors, the kind of relations we have within the model:
- RED – Means that the table has NO parents but it HAS children, we could think that these are the catalog tables we need to get info from.
- GREEN – They HAVE parents and HAVE children, meaning that they must be the tables we are going to be using to connect information to the system.
- YELLOW – These are the ones WITH parents, but NO children; these are going to be important too since we may have to work with them to maintain the integrity of the system.
- BLACK – At last these are the ones that are NOT related at all, sometimes these are tables we are not going to be using, they may be logs or tables that are not used anymore.
Once we have this sampling and we know the relations, we are now ready to set the rules and formulas that will build each one of the particular data sets.
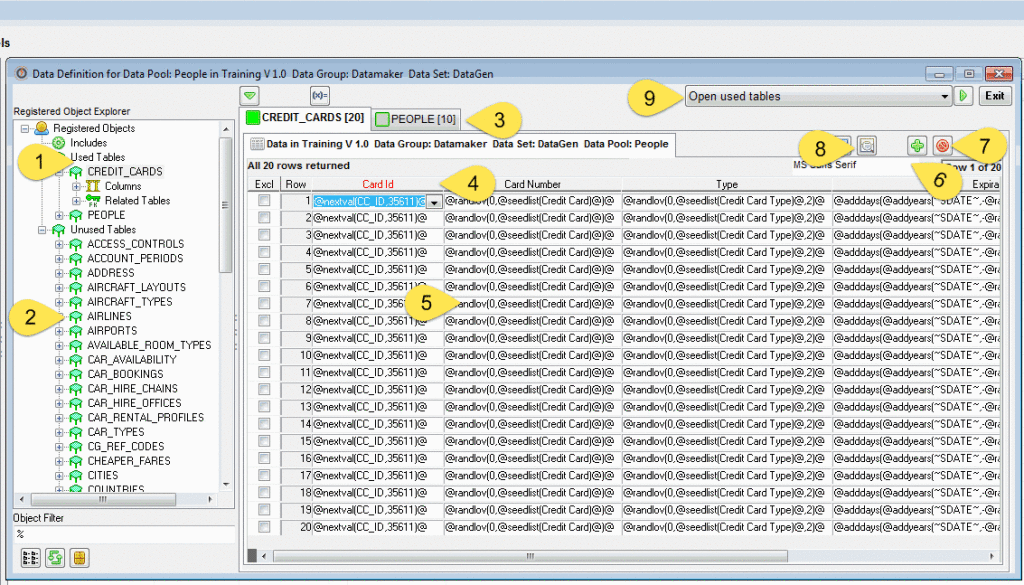
The data set can be managed as a simple spreadsheet that will allow us to add relations, formulas, and values that will create unique combinations of data based on our needs.
At a first sight, it may look scary and confusing, but the window is not that complicated. The left panel will show the tables available to use, on top we have the one we are currently using (1) and then the ones that we can use (2).
The right panel, shows the tables we have opened (3) and the columns of the table we are working on (4) with the values we have set up to create the data (5). On the top, we have the tools to add (6) and remove (7) rows to the set or to get a preview of our work (8). And lastly we have multiple options to open, manipulate and publish the data we are working on (9).
If you want to know more about how to create a Datamaker data set, please visit our YouTube channel and check our Grid-tools Test Data Management Overview & Demo webinar.
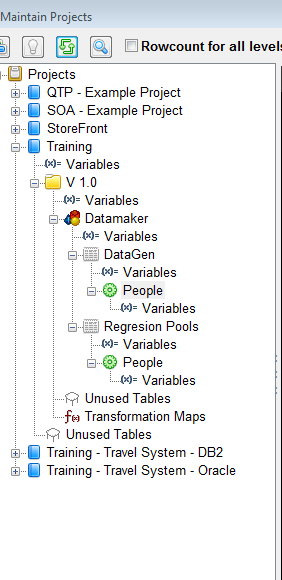
Another common problem is attempting to keep track of changes. Datamaker uses a tree-like structure making versioning as straightforward as possible. It lets us handle multiple versions for the same project and share information between them.
We can also have multiple projects on the same server. Each one of them being assigned to the team/group that is working with it, without the risk of mixing or confusing project requirements.
As you can see, Grid Tools suite can help us improve the way we generate data. Making the process less painful and more dynamic, following the right and precise direction of our needs. If you want to know more about how Grid Tools can help you, feel free to contact us.


