Summary
Performance monitoring is built into the Windows operating system and every metric available is being constantly monitored, whether you choose to view it or not. There are many different built-in tools that will allow you to view this performance data such as Taskgr.exe, Perfmon.exe, or Typeperf.exe. You can also access this performance data through code inside your application, written in script or compiled languages, such as C or C#.
Overview
Microsoft Performance Monitor (Perfmon) will allow you to track system and process resource usage. Out of the many tools that can allow you to do this, Perfmon is the easiest to use and most popular. Typeperf is also easy to use and I cover its usage as well in this document.
Here are three reasons why QA staff should become familiar with using Windows Performance Monitor:
- You have detected high resource usage and you want to verify and track it. Such as:
- Memory leak in a process: You want to verify it and find the rate of it. Examples are bytes per second, minute, or hour. If the developer knows the rate of the leak, it helps them determine which objects might be leaking by matching the leak rate with the object size.
- CPU usage: If a process seems CPU bound, Perfmon will point this out immediately.
- Disk IO: Perfmon can track physical disk reads, writes, etc.
- You want to know the general behavior of the system or a specific process. You may not have an issue that you are investigating, but looking at the general behavior may give insight into how your application runs.
- You want to take a before and after performance profile snapshot. For example, run version 1.0 of your process for several hours tracking and saving everything with Perfmon, then compare that with the same duration and usage with version 1.1. Determining the delta between the two could direct you to focus in on existing or potential issues.
Understanding Performance Monitoring General Concepts
From Perfmon’s perspective, everything in the windows operating system is viewed as an object, then an instance, then a counter. For example the Processor is an object, PhysicalDisk is an object, and Processes are an object. For the Processor object, the first processor instance on your system would be processor0 or all of them combined are “_Total”, for the PhysicalDisk the first instance would be disk0 or all of them combined are “_Total”, and for Processes an instance could be “notepad”, or “Org.Intermountain.ECISDesktop”. Then, for the Processor _Total we have a counter named “% Processor Time”, for PhysicalDisk _Total we have a counter named “Disk writes/sec”, and for Processes notepad we have “private bytes”. These three examples can be represented in the format of:
\Object(instance)\Counter
Or specifically as:
\Processor(_Total)\% Processor Time
\PhysicalDisk(_Total)\Disk writes/sec
\Process(Org.Intermountain.ECISDesktop)\private bytes
Task Manager
Task Manager will allow you to do some rudimentary performance monitoring but does not allow you to record it or see much history. To run it, type “taskmgr” from a command prompt or from the Run prompt (Window + R), or hitting Ctrl + Shift + Esc will bring it up.
Typeperf.exe
Typeperf is a tool to view performance counters quickly and illustrates the example above well. It does not have a UI like Perfmon but it can be easily run from an automation script, is efficient to use, and results can be viewed in the cmd window or in Excel. To use Typeperf, open a command window and then type or paste in the following command:
typeperf "\Processor(_Total)\% Processor Time"
You will see the one counter display its values to the screen. After viewing this type Ctrl + C to stop it. To see a full list of Typeperf command line parameters type:
typeperf /?
Now let’s view a list of performance counters using Typeperf. From the command window type:
notepad counters.txt
Answer yes to create a new file and paste in the following text and save the file:
"\Processor(_Total)\% Processor Time"
"\PhysicalDisk(_Total)\Disk reads/sec"
"\PhysicalDisk(_Total)\Disk writes/sec"
"\Process(Notepad)\Private Bytes"
"\Process(Notepad)\% Processor Time"
"\Process(Notepad)\Virtual Bytes"
"\Process(Notepad)\Thread Count"
"\Process(Notepad)\Handle Count"
Load Notepad.exe, then type the following command to view each of these counters in counters.txt to the screen:
typeperf -cf counters.txt -si 1
Finally, let’s log these counters to a comma separated file (.csv) every 5 seconds and take 50 samples (5 * 60 = 300 seconds, or 5 minutes), then stop. Before running this, load up a fresh copy of the Notepad.exe process. Then, after running the below command, use Notepad in a normal usage scenario for 5 minutes to see what the counter values are for the duration its execution. An example of normal usage would be typing, copying, pasting, Page Setup, Font selection, Printing, Save, Save As, etc.
typeperf -cf counters.txt -si 5 -sc 50 -f CSV -o NotepadCounters.csv
After 5 minutes, you should have a .csv file with all the counter values for 5 minutes. You can directly paste this into Excel for analysis, or open it in Excel using File > Open. In my example, I used Excel to make a line chart with the private usage beginning with the process loaded, then the normal usage scenario. To create a line chart in Excel, just click the column header to select the entire column, then from the Insert menu choose Chart, Line.
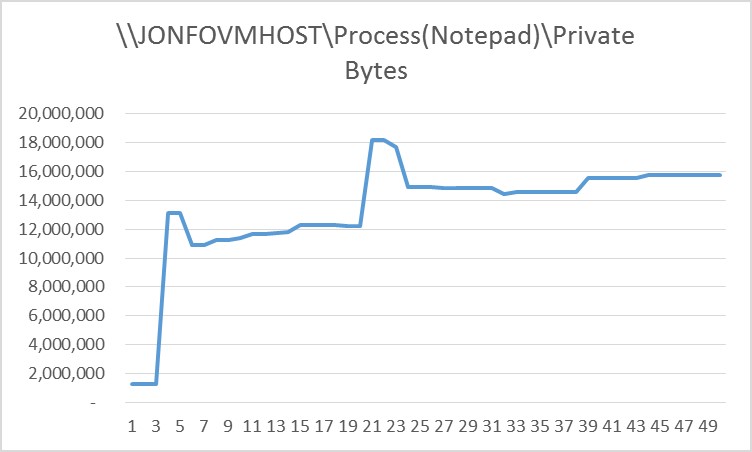
In my quick analysis, I have determined that the private bytes my Notepad process begins at less than 2MB when loaded, increased to about 10MB using the Print Setup, Save As dialogs, peaked at 18MB in the Font, and Print dialogs, it then leveled out at about 15MB. Now let’s do the same thing in Perfmon.
Setting up Perfmon
Perfmon is part of Windows XP, Windows 7, Windows 8, and beyond, so there is no install. It is typically located at C:\Windows\system32\perfmon.exe, but in Windows 7 and Windows 8 it runs in the mmc.exe process as a Snap In.
Using Perfmon
From the cmd window, run window (Window Key + R), or search window type “perfmon”.
UI Differences Between Windows Versions
The UI is different in each OS (Windows XP, Windows 7, and Windows 8), but the functionality is mostly the same. I will give directions using Windows 8.1.
Modes of Operation
Permon can run in two different modes, real-time and logging. For this discussion, I will mostly discuss logging mode because the real-time mode is the same, except that nothing is saved.
Real-time mode
You can run in real-time mode, where you are just collecting performance monitor information for a quick look at some performance counters. When you are done and you close Perfmon, the information is lost except for what you remember. This can be useful where you just want to take a quick look at something but not record it.
Logging Mode
Logging mode is most useful because you can save the information permanently for future reference. The only downside is that the logs can get large and you have to manage the log files with unique names, etc.
How to Collect Performance Counters in Logging Mode
The following instructions should guide you in the same operation we used for Typeperf, collecting the same counters.
- Type “perfmon” to open Performance Monitor. Alternatively, you can load Perfmon from Control Panel, Administrative Tools, Performance. Use this method if you are having access rights.
- You must be in the Administrators group on the machine you are running this on, or you will get errors on the next steps.
- Open the “Data Collector Sets” tree on the left.
- Right-click on “User Defined” and choose “New”, “Data Collector Set”.
- Give the log a logical name such as “Notepad1”.
- Click the radio button for “Create manually (Advanced)” and choose “Next”.
- On the “What type of data do you want to include?” dialog choose the radio button “Create data logs” and check the “Performance counter” checkbox, then choose “Next”.
- You will then be on the on the Performance Counters dialog.
- Click “Add …”
- Processor
- Choose “<Local computer>”
- Under Performance Object choose Processor (as we did in the TypePerf example)
- Click on the down arrow to show all the counters for the Processor object.
- Select only “% Processor Time”
- On the bottom make sure _Total is chosen, and choose “Add >>”.
- Process
- Under Performance Object choose Process
- On the bottom make sure “Notepad” is chosen.
- Click on the down arrow to show all the counters for the Process object.
- Hold down the Ctrl button to multi-select and then select “% Processor Time”, “Handle Count”, “Private Bytes”, “Thread Count”, and “Virtual Bytes”.
- Choose “Add>>”.
- Physical disk
- Under Performance Object choose PhysicalDisk
- Click on the down arrow to show all the counters for the PhysicalDisk object.
- On the bottom make sure _Total is chosen, and choose Add.
- Hold down the Ctrl button to multi-select and then select “% Disk Time”, “Disk Read Bytes/sec”, “Disk Read Bytes/sec”.
- Processor
- Click Ok on the dialog.
- The default logging interval is 15 seconds, change it to 1 second so we can get more samples in a short time. Normally this would be too frequent and create very large log files, but for this example it makes sense.
- Select Ok to close the dialog.
- You may get a message to create c:\perflogs, and choose yes.
- Finally, choose “Finish”.
Modify the Log Settings
- From the Permon main screen navigate to Data Collector Sets, User Defined.
- In the tree click on Notepad1.
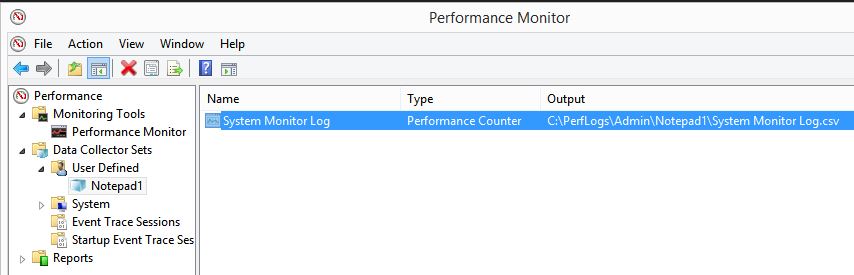
- In the main area of the screen to the right, Right-click on DataCollector01 and choose Properties.
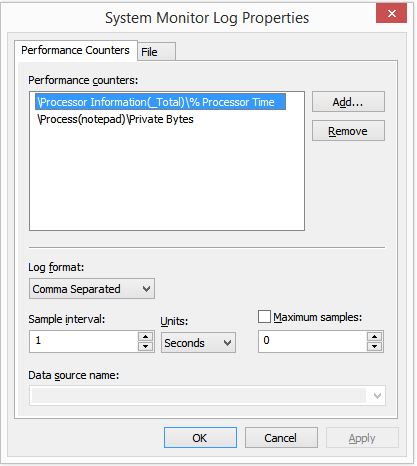
- The “Performance Counters” tab will be selected by default.
- Change the “Log format” from the default of binary to “Comma Separated”.
- Note: Changing the log format from Binary to Comma Separated makes the output from Typeperf and Perfmon identical. This means you can create the logs using Typeperf in automation, and read them later with Perfmon if you want to.
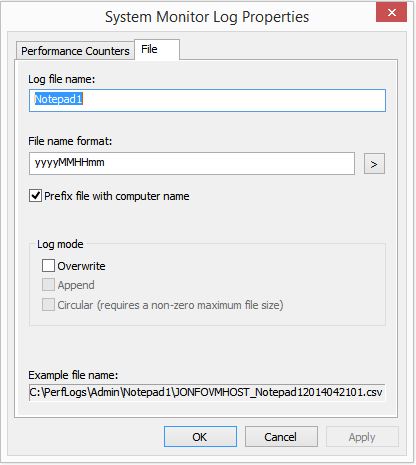
- Click on the “File” tab.
- Change the Log file name to “Notepad1”.
- Change the File name format to “yyyyMMHHmm”
- Check the checkbox for “Prefix file with computer name”.
- Select Ok to close the dialog.
Start Performance Logging
We will now record counter logs that can later be read by Perfmon.
- From the Permon main screen navigate to Data Collector Sets, User Defined.
- Right-click on Notepad1, and choose Start.
- Remember the counter sample rate is set to 1 second, so we are getting frequent samples for a memory usage profile over a short duration.
- Do some operations in Notepad
- Determine when you want to stop using Notepad logging and view the logs.
- From the Permon main screen navigate to Data Collector Sets, User Defined.
- Right-click on Notepad1, and choose Stop.
How to Read Performance Counters in Logging Mode
We will now read the counter logs that we logged.
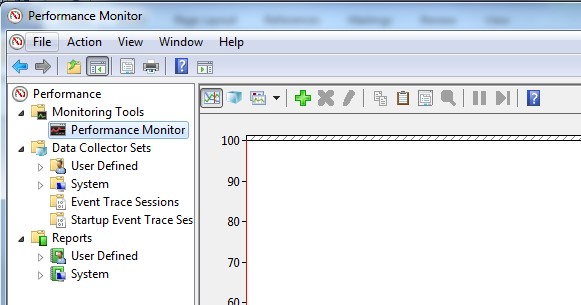
- Open the “Monitoring Tools” tree on the left. Click on “Performance Monitor”.
- Click “View Log Data” icon, or hit Ctrl+L to load a log file.
- Choose “Log Files”, “Add…”, and then choose the latest Notepad1 log file. By default it will be at c:\PerfLogs\Admin\Notepad1\System Monitor Log.csv.
- You can optionally choose a Time Range within the log file to narrow down an issue within a smaller time duration.
- Now Click the “+” icon or Ctrl+I to add counters from the log to the view.
- Choose each of the three objects and all counters.
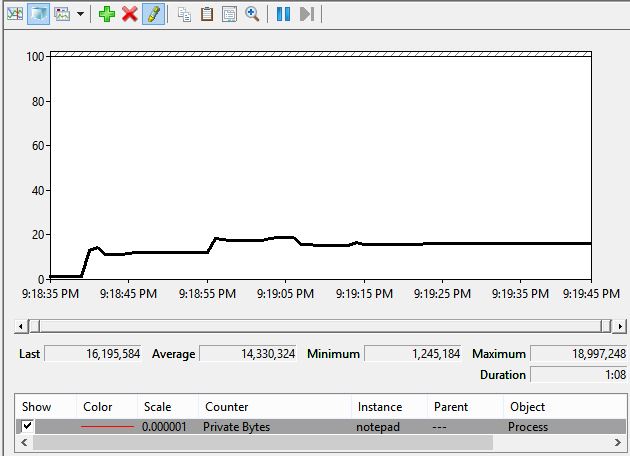
- You can now see all the values in the UI and can change properties such as scale so the fit in the screen properly.
- Clicking the Pen icon, or hitting Ctrl + H will highlight the currently selected counter to make it easier to see which one you are looking at.
- If the recording session was the same as what you did in Typeperf earlier, then the Perfmon view and the Excel line chart view should be similar.
Jon Fowler, Senior Consultant at Orasi Software