Summary
The goals of this Tutorial are to understand what a crash is, learn how to explicitly create a crash in code, use tools to analyze a crash, and learn how to gather information to file a defect. This will cover basic debugging, not advanced.
Overview
The dictionary definition of “crash” does not really explain much. A better (and longer) description is a catastrophic failure, where the run-time execution of the code got to a place that it cannot continue, and must exit the process, as there is no alternative. Anything that does not result in a complete termination of the process is handled by structured exception handling (SEH), hence not a crash. If SEH does not exist in the code, any small error could cause a crash; but if there is at least one top level SEH block, it should catch handle-able exceptions and make smart decisions about how to handle them.
There are three common run-time crash conditions that are difficult or impossible to handle in managed code; 1) null reference exception, 2) stack overflows, 3) out of memory exceptions. I will explain each below:
- Null reference exceptions – a reference to a null (non-instantiated) object is made which causes a memory access violation.
- Stack overflow – The stack size for the process has been exceeded, likely caused by an infinite loop, or cyclical reference.
- Out of memory (OOM) exception – The process tries to allocate more memory but all available memory has been exhausted and it cannot allocate more. This usually happens on a “New”.
If we want to catch the root cause of these conditions at run-time we can use the Microsoft systems debuggers, cdb or windbg, to debug the process. These debuggers can be used for the following at a minimum:
- Get the call stack of an unhandled exception (crash) that is occurring within the process.
- Find and debug memory leaks once you know they already exist. This is a more advanced topic but useful.
- Find other issues that are not detected without cdb attached such as first chance access violations (AV) that are hidden bugs.
- Provide memory dumps (.dmp files) for developers to debug offline.
Step-By-Step Examples
We will build a .Net application using Visual Studio that purposely has a null reference exception, a stack overflow, and an out of memory exception. These are the three most common exceptions found in managed applications so it is helpful to see code that causes them.
CrashApp
New Project
- File, New, Project
- Visual C#, Windows, Windows Forms Application
- Location: c:\Orasi\VS\Projects
- Name: CrashApp (or whatever you want to call it)
Add NullRef
- Toolbox (floating on left)
- Common controls, Button
- Properties (F4)
- Text: Null Ref
- (Name): buttonNullRef
- Double-Click on buttonNullRef to get to code.
Code
Using System.IO;
private void buttonNullRef_Click(…)
{
 FileStream f = null;
 string path = @"c:\orasi\VS\Projects\Data\Customer.txt";
 if (File.Exists(path))
 {
  f = File.OpenRead(path);
 }
 f.Close();
}
Run
- Set a break point in the code using F9
- Run from VS – F5
- Click the button to get to the break point.
- Use F10 to walk to f.Close().
- It should fail if the file path does not exist.
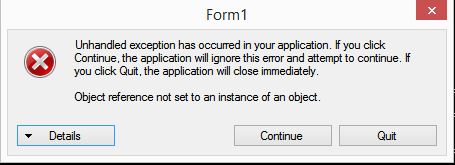
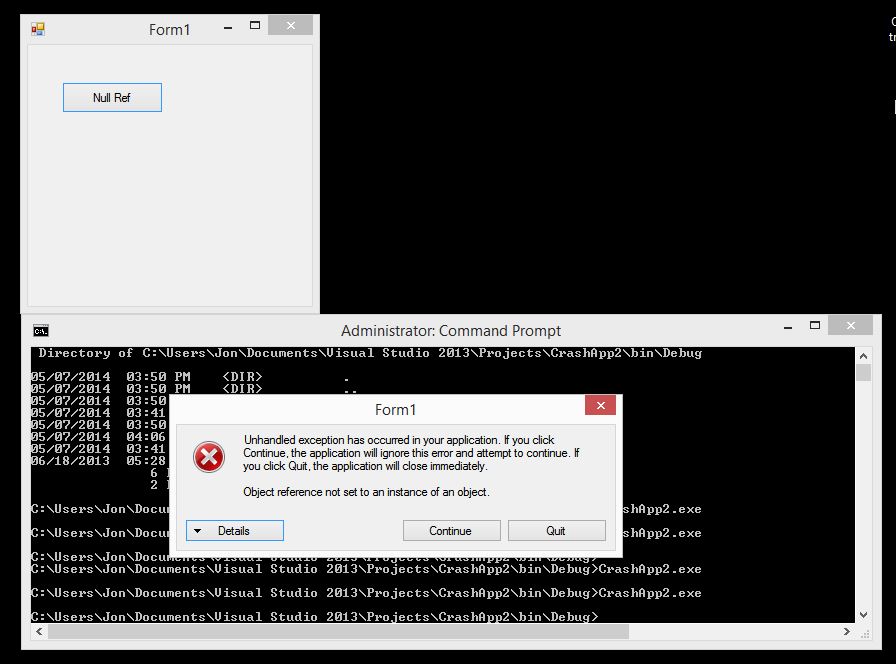
- Now run from the Command Prompt or Windows File Explorer, the behavior will be different because you will not be running in the VS environment. This behavior will be more like what the user would experience, although since you have VS installed on this machine it may give you debugging options when it fails rather than just a hard crash.
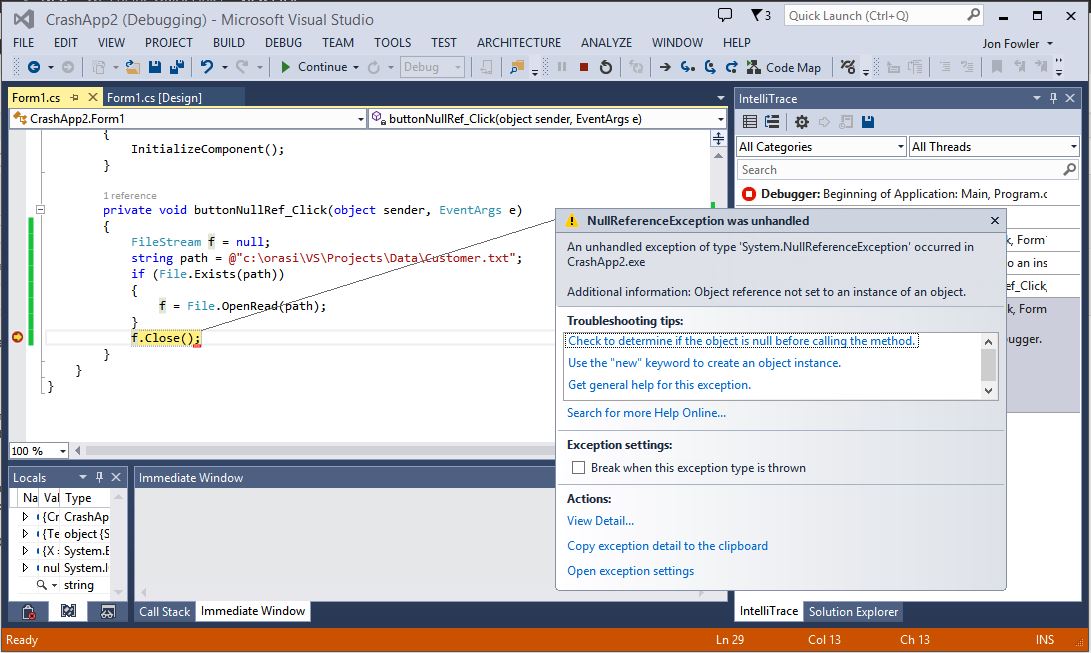
Ide Crash Image
Non-IDE Crash Image
StackOverflow
- Toolbox (floating on left)
- Common controls, Button
- Properties (F4)
- Text: Null Ref
- (Name): buttonStackOverflow
- Double-Click on buttonStackOverflow to get to code.
Stack Overflow code
private void buttonStackOverflow_Click(…)
{
  f1();
}
private void f1()
{
  f1();
}
- Use the Run description described for the Null Ref exeption
Crash App – OOM
- Toolbox (floating on left)
- Common controls, Button
- Properties (F4)
- Text: Null Ref
- (Name): buttonOOM
- Double-Click on buttonOOM to get to code.
CrashApp – OOM Code
private void buttonOOM_Click(…)
        {
            List<Leaker> l = new List<Leaker>();
            while(true)
            {
                l.Add(new Leaker());
            }
        }
 class Leaker
    {
        int x = 0;
        string y = "";
    }
- Use the Run description described for the Null Ref exeption
Debuggers
Running the application we created, with the debuggers attached, will allow the debuggers to catch the issues and perform root cause analysis.
Setup
- Install cdb on the machine that will be running the process that will be monitored:
- http://msdn.microsoft.com/en-US/windows/hardware/hh852363
- Click Install and Download
- Ignore that it mentions Windows 8
- Uncheck every option except
- Windows Performance Toolkit
- Debugging Tools for Windows
Configuring System PATH
We need to add the debugging directory to the System Path which sets the cdb.exe location permanently. Here are the steps to do this:
- In Start menu, right click on Computer, choose Properties, Advanced System Settings, Environment Variables…, System variables
- Find variable name Path.
- Click Edit, then hit the End key to go to the end of the line.
- Carefully append the following text that begins with a semi-colon:
- ;C:\Program Files (x86)\Windows Kits\8.0\Debuggers\x86
Symbols
Symbols are needed at debugging time, to determine the root cause of a failure or memory leak. However, they are not needed at runtime, meaning that while the process is running, the symbols are not needed. They are only needed after a failure has occurred and you intend to debug the failure. I don’t usually debug a failure on the machine that the failure occurred on; we can create a dump file of the failure and debug the dump file at a later time on another system. This allows your test machines to keep finding new failures and saving dump files, while you debug them at your leisure.
_nt_symbol_path – Temporary
- Set the default symbols path for operating system symbols
- There is an environment variable named _nt_symbol_path that all Microsoft tools look for. Yes, the path begins with an underscore, and if you don’t include it, it won’t work.
- Set the Symbol path from the command line
- When debugging from the command line, the following command can be used with semi-colon delimiters between paths.
- set _nt_symbol_path=srv*http://msdl.microsoft.com/download/symbols
_nt_symbol_path – Permanent
- Set the symbols path permanently
- Right click on My Computer, Properties, Advanced System Settings, Environment Variables, System, New
- Variable name: _nt_symbol_path
- Variable value:
- srv*http://msdl.microsoft.com/download/symbols
Application Symbols
For our example here, the symbols will be in the same directory as the executable so there should not be any symbols setup, unless you are running from another machine. In which case, you can just copy the corresponding .pdb file with the .exe or .dll. However, when testing an application you did not create, you will need to acquire the symbols from the owner or the builder/build team. The symbols need to match the binaries exactly for the build and date/time; symbols from a previous build will not work. In practice you can end up spend more time getting correct symbols than debugging the failure, and it can be frustrating. After you have acquired symbols, it is common to either 1) put them in the same directory as the executables (.exe/.dll), or 2) to put them in a separate directory and add the directory to the _nt_symbol_path environment variable.
I will explain the dump commands later to debug offline with symbols.
Cdb – Console Debugger
Connecting
You will need to either connect to a running instance of your process, or launch the process using the debuggers. These are explained below:
- Help
- Cdb /?
- Attach to using process name
- Cdb –pn crashapp.exe
- Attach to using process name, and do not stop on attach or exit
- Cdb -g -G –pn crashapp.exe
- Attach to using process Id, and do not stop on attach or exit
- Cdb -g -G –p 992
- Attach to using process name, and do not stop on attach or exit
- Cdb -g –G –pn crashapp.exe
- Launch in debugger using executable name, and do not stop on attach or exit
- Cdb –g –G crashapp.exe
- Set Windbg to be the “Postmorten debugger”. This means any time any application on your machine gets a crash, Windbg will attach to it.
- Windbg /I
Disconnecting
- To break into the running processTo quit and terminate the application
- Ctrl + C
- To detach and leave the application running
- .detach
- To quit cdb
- q
Logging
To log console output:
- .logopen c:\orasi\Crashapp1.log
- .logclose
- .logappend c:\orasi\Crashapp1.log
Help Commands
When debugging a process or dump file:
- ? – help
- .help – dot commands help
- !help – extensions help
- .hh – load windows help file
Creating a Dump File
- Ctrl + C to break in
- .dump /ma c:\orasi\Crashapp1.dmp
- Exit
- To quit and terminate the application
- q – quit
- To detach and leave the application running
- .detach – to disconnect
- q – to quit
- To quit and terminate the application
Debug the Dump File
- Cdb –z c:\orasi\Crashapp1.dmp
- .dumpcab –a c:\orasi\Crashapp1.cab
- q – to quit
Commands
- !peb – Get machine/environment info
- .lastevent – show failure
- lm – load modules (list modules)
- Lm v mclr – show info about module (clr)
- .sympath – show symbols path
- | – show process information (pipe)
- .reload – reload symbols
- .reload /f – force reload symbols
- .reload /f clr – force reload one module
Debugging Commands
These commands will give you stack backtrace and thread information.
- Kb – stack backtrace
- ~ – list all native threads
- ~*kb – list stacks on all threads
- ~3s – change to thread id 3
Managed Code
By default, the debuggers assume you will be debugging native (non-managed or non-.Net) processes. .Net processes are different in that they include a small native bootstrap, which ultimately loads the .Net IL in the .Net runtime. Cdb needs to use an add-in named SOS to debug managed code. SOS has a similar, but different, set of commands that begin with the ! prefix. To get help on these use !help after SOS is loaded.
- .loadby sos clr – Loads add-in SOS (Son of Strike)
- !sos.help – SOS help
- !threads
- !dumpstack
- !clrstack
- !analyze –v
Command Line Interface – Advanced
- -x – Sets second-chance break on AV exceptions
- -s – Disables lazy symbol loading
- -cf – File specifies a script file to be processed at the first debugger
- -logo – Log file path
- -pv – Specifies that any attach should be noninvasive
- -pvr – Specifies that any attach should be noninvasive and non-suspending
-CF Flag
Since we may want to put unique output in the –cf file, it makes sense to create it on the fly from a batch program. Here we demonstrate a batch file that would write out the cf file, with a unique log file name, and then attach the debugger with the –cf command.
@ECHO OFF
ECHO Began at %DATE% %TIME%
ECHO .loadby sos clr;!peb;!dumpstack;!analyze -v;.dump /ma c:\orasi\Crashapp3_%RANDOM%.dmp;q; >cf.txt
cdb -g -G -cf cf.txt -logo c:\orasi\Crashapp3.log WindowsFormsApplication1.exe
ECHO Ended at %DATE% %TIME%
Conclusion
Building the application described above in Visual Studio will allow you to cause crashes and debug them using the Microsoft System Debugging Tools.
Links
Jon Fowler, Senior Consultant at Orasi Software